 Aleksander Roszig
June 7, 2026 | 9 min Read
Aleksander Roszig
June 7, 2026 | 9 min ReadKubernetes CPU Throttling: Why Pods Get Throttled at 40% CPU (CFS)
This is the third part of our series on Kubernetes resource management. In the first part I covered CPU request and limit in Kubernetes, and in the second I explained how requests and limits behave for memory. This article covers the topic that trips up the most engineers in production: CPU throttling. It is the reason a pod can look completely healthy on every dashboard and still miss its deadlines.
The symptom: a pod that looks fine, but the application is not performing as expected
One of the hardest incidents to debug is the one where every graph says everything is fine.
A typical example from a data pipeline: a service ingests messages and writes them to a database.
The first thing everyone does is open the CPU graph. And the CPU graph says the pod is sitting at 40% utilization. So the investigation goes everywhere else first — the network, the database, garbage collection — while the one metric that actually matters goes unwatched.
It is CFS throttling: a Linux kernel mechanism that the container runtime and Kubernetes use to enforce CPU limits. And almost no default dashboard shows it.
What is CPU throttling in Kubernetes?
CPU throttling is what happens when a container exhausts the quota of its CPU limit within a single scheduling window. The Linux scheduler hands out CPU time in fixed periods — 100 ms by default (cpu.cfs_period_us in cgroups v1; the period field of cpu.max in cgroups v2). Within each period, a cgroup may consume only up to its quota of CPU time. Once a group’s consumption reaches that quota for the period, every task in its hierarchy is throttled — paused, and not allowed to run again until the next period begins.
Two mechanisms from the CPU controller in cgroups are in play, and they are easy to confuse:
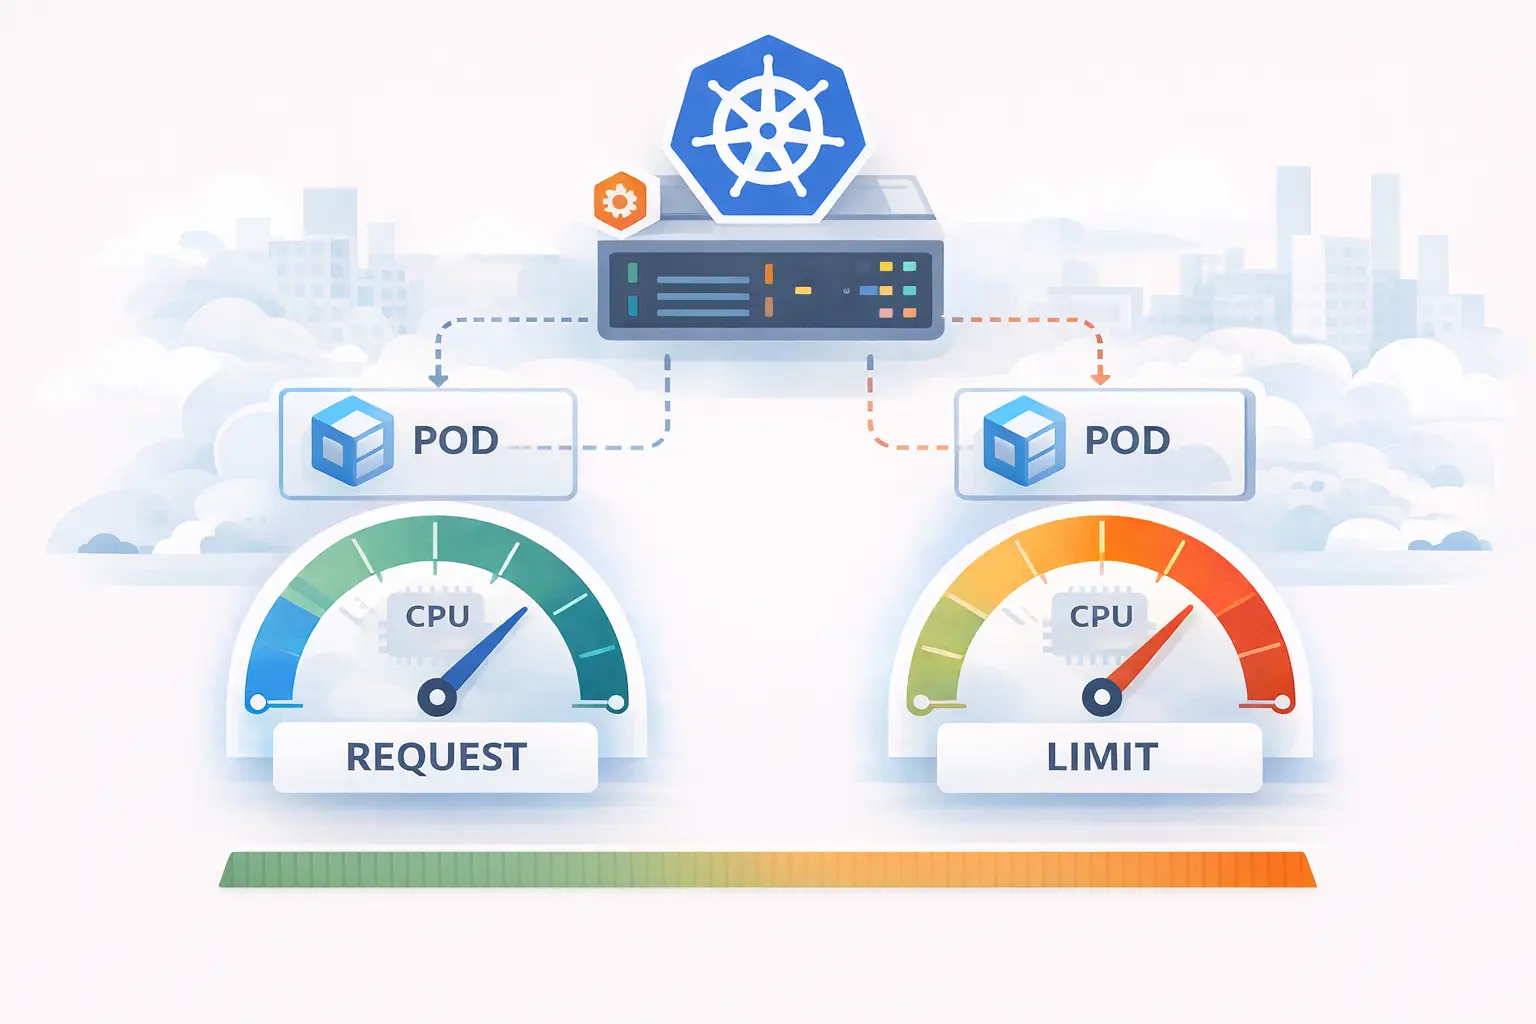
- The weight model backs the CPU request. It decides the proportional share of CPU a container gets when there is contention.
- The bandwidth (quota) model backs the CPU limit. It is an absolute cap, enforced per period, and it is the thing that causes throttling.
Both mechanisms are covered in detail in the request and limit post.
Requests never cause throttling. Limits do.
How CFS throttling actually works
Three numbers decide whether your container gets throttled:
- The CPU limit — say
2000m. - The CFS scheduling period — 100 ms by default (
cpu.cfs_period_usin cgroups v1; the second field ofcpu.maxin cgroups v2). - The number of CPU cores on the host — here, 4.
Kubernetes converts the limit into a CFS quota the same way the kubelet does in part one’s MilliCPUToQuota:
quota_µs = (milliCPU * period_µs) / milliCPUToCPU(1000)

for a 2000m limit and a 100 ms (100000 µs) period:
quota_µs = 2000 * 100000 / 1000 = 200000 µs   // 200 ms of CPU time per period
With a 2000m limit and a 100 ms period, the container gets 200 ms of CPU time per period. The container can spend that 200 ms across every core on the node, at the same time.
Now picture an HTTP-style service on a 4-core node. A single resource-intensive request fans out across all four cores. In just 50 ms of real time, working on 4 cores in parallel, it consumes 4 * 50 ms = 200 ms of CPU time. The entire period’s budget is gone in 50 ms of real time — half of the CFS period.
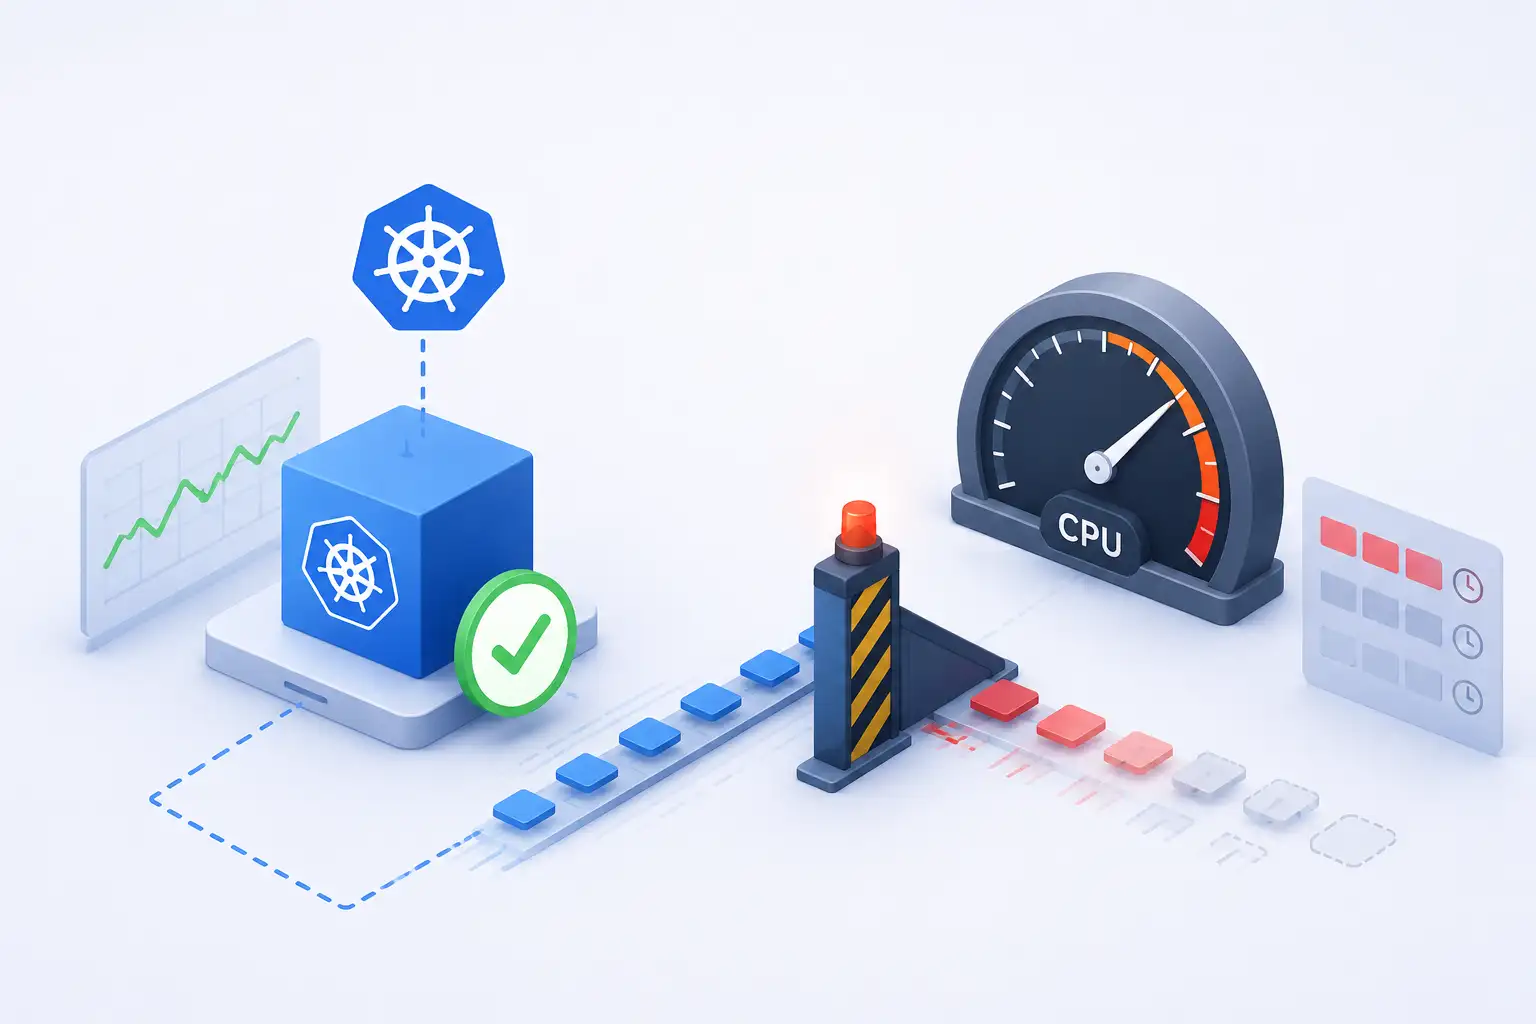
For the remaining 50 ms of that period, the container is frozen. Any request that arrives in that window waits — not because the CPU is busy, but because the kernel has paused the container until the start of the next period.
If your load looks like burst, idle, idle, idle, burst — which is exactly what request-driven and event-driven workloads look like — then the bursts get throttled while the CPU graph shows a calm 40%.
That is precisely how a tight-deadline request dies with context deadline exceeded. The work didn’t get slow. It got paused by the kernel mid-flight, and the deadline expired during the pause.
cgroups v1 vs v2: where to read it
The 100 ms period and the throttling behavior are identical between cgroups v1 and v2 — what changes is where you read it.
| Concept | cgroups v1 | cgroups v2 |
|---|---|---|
| CPU limit (quota) | cpu.cfs_quota_us + cpu.cfs_period_us | cpu.max (<quota> <period>) |
| CPU request (weight) | cpu.shares (default 1024) | cpu.weight (default 100) |
| Throttling counters | cpu.stat | cpu.stat |
Most modern distributions — Amazon Linux 2023, Ubuntu 22.04+, RHEL 9+ — default to cgroups v2, so a single cpu.max file holds both the quota and the period. The cpu.stat file exists in both versions and reports the same throttling counters.
How to check for CPU throttling in Kubernetes
The kernel records this for every container that has a CPU limit, in /sys/fs/cgroup/cpu.stat:
kubectl exec <pod> -- cat /sys/fs/cgroup/cpu.stat
usage_usec 49823715
user_usec 41205893
system_usec 8617822
nr_periods 300
nr_throttled 30
throttled_usec 6142188
nr_bursts 0
burst_usec 0
The two lines that matter:
nr_throttled— how many scheduling periods ended with the container throttled.throttled_usec— total microseconds the container spent frozen.
If those climb over time, you have your answer — no matter what the average CPU graph claims. In the example above, 30 of 300 periods (10%) were throttled. For a latency-sensitive service, that is already enough to wreck p99.
If you run Prometheus and cAdvisor, the same signal is exposed as container_cpu_cfs_throttled_periods_total and container_cpu_cfs_throttled_seconds_total (divide the throttled periods by container_cpu_cfs_periods_total to get a throttling ratio you can alert on). Note that kube-prometheus ships a CPUThrottlingHigh alert, but many installations disable it — it fires so often, and so frequently on non-actionable cases, that teams silence it. Don’t assume “no alert” means “no throttling.”
What to watch instead of average CPU
cpu.stat is the direct check. For a complete picture, watch four signals together:
| Signal | Where | Catches |
|---|---|---|
| CFS throttling | cpu.stat → nr_throttled, throttled_usec | Container hit its own cgroup CPU budget |
| Kernel PSI | cpu.pressure (cgroup) | Saturation from contention with other workloads, even under quota |
| Steal time | %st in top | Hypervisor gave your vCPU’s slot to another tenant |
| App scheduler latency | Go: /sched/latencies:seconds | Goroutines waiting to run — Go language-level starvation |
A few practical notes:
- PSI (
cpu.pressure) is the underused one.cpu.statonly fires when the kernel actively pauses you for quota. PSI reports the percentage of wall-clock time during which a task was runnable but not running — so it catches saturation caused by noisy neighbors on the host, not just your own quota exhaustion. - Steal time is invisible to cgroups. On a VM, hypervisor-level contention never shows up in
cpu.stat. You only see it as%stintop: your code is ready, but the physical CPU is busy with another tenant. - Application-side starvation detection is the longer-term fix. The application periodically asks whether a millisecond still takes a millisecond; if wall-clock time is stretching relative to CPU time, something above it — CFS throttling, steal time, a sibling process burning the shared budget — is starving it. CockroachDB does this with a controller around Go’s scheduler-latency histogram, and Redpanda flags “reactor stalls” for the same reason. As of Go 1.25,
GOMAXPROCSis cgroup-aware by default, which reduces (but does not eliminate) the problem — it won’t help when another process in the same container burns the shared budget.
What to actually do about it
There is no single knob, but the decision tree is short:
- Confirm it’s throttling, not saturation.
cpu.statclimbing + low-average CPU = throttling. High average CPU + high PSI = genuine saturation, which is a scaling problem, not a limit problem. - Raise or reconsider the CPU limit. If a burst legitimately needs more parallelism than the budget allows, the limit is too tight. Many teams now run with CPU requests set and CPU limits removed (memory limits stay), letting bursty workloads use idle node capacity while requests still guarantee a baseline. This is the requests vs limits trade-off in practice.
- Fix the budget shape, not just its size. Spreading work over more periods (smaller bursts) can avoid throttling at the same average. Sometimes the answer is in the application, not the manifest.
- Keep limits where compliance requires them — and monitor throttling so you know the cost.
Should you set CPU limits at all?
As always, it depends — and the honest answer is the same one we gave for requests in part one. Always set requests. They cost nothing in throttling, and they give the scheduler what it needs to place the pod and guarantee a fair share under contention.
CPU limits are the debatable part. A limit caps your ability to process work quickly even when the node has spare cycles nobody else is using — which is the opposite of what cloud computing, autoscaling, and efficient infrastructure are supposed to buy you. For a latency-sensitive service on a cluster you control and monitor, a limit often does more harm than good.
But there are real scenarios where a limit is the right call:
- Multi-tenant clusters — several teams or customers share one cluster and need isolation.
- Untrusted workloads — you don’t fully control the code running in the containers.
- Runaway protection — a guard against infinite loops or a stray crypto-miner.
- Cost control — a hard budget for scheduling, billing, or accounting reasons.
- Managed platforms — services like AWS Fargate require CPU (and memory) to be set at the task level.
In those cases the limit buys isolation and predictability, and that is worth the throttling cost.
Summary
When you set a CPU limit on a container, you are not capping the number of cores it can touch. You are giving it a time budget per 100 ms period. A single burst can exhaust the period and freeze the container for the rest of it — while the averaged CPU graph stays calm and your p99 latency climbs. This is the trap of k8s CPU throttling: the dashboard looks healthy right up until a deadline is missed.
What to watch instead of the average CPU:
- cgroup throttling:
nr_throttledandthrottled_usecincpu.stat(orcontainer_cpu_cfs_throttled_*in Prometheus) - kernel PSI:
cpu.pressurefor saturation under quota - hypervisor steal time:
%stintop - application starvation signals (in Go,
/sched/latencies:seconds)
If you’re running latency-sensitive workloads on Kubernetes — especially data pipelines or time-series data — and you want observability that surfaces throttling before it costs you a deadline, at RoszigIT we design and deploy the Kubernetes + Grafana stack. Get in touch if you need a second opinion or hands-on help with the architecture.