 Aleksander Roszig
August 8, 2026 | 6 min Read
Aleksander Roszig
August 8, 2026 | 6 min ReadKubernetes HPA: Horizontal Pod Autoscaler on CPU and Memory
Table of contents
Autoscaling is one of the main reasons companies move to Kubernetes or in general want to use cloud. Yet in many clusters we audit, the Horizontal Pod Autoscaler is either not used at all or configured in a way that actively hurts the application. The number of replicas is picked once, hardcoded in a manifest, and the cluster pays for peak capacity 24/7. That’s the opposite of what a cloud native environment should look like.
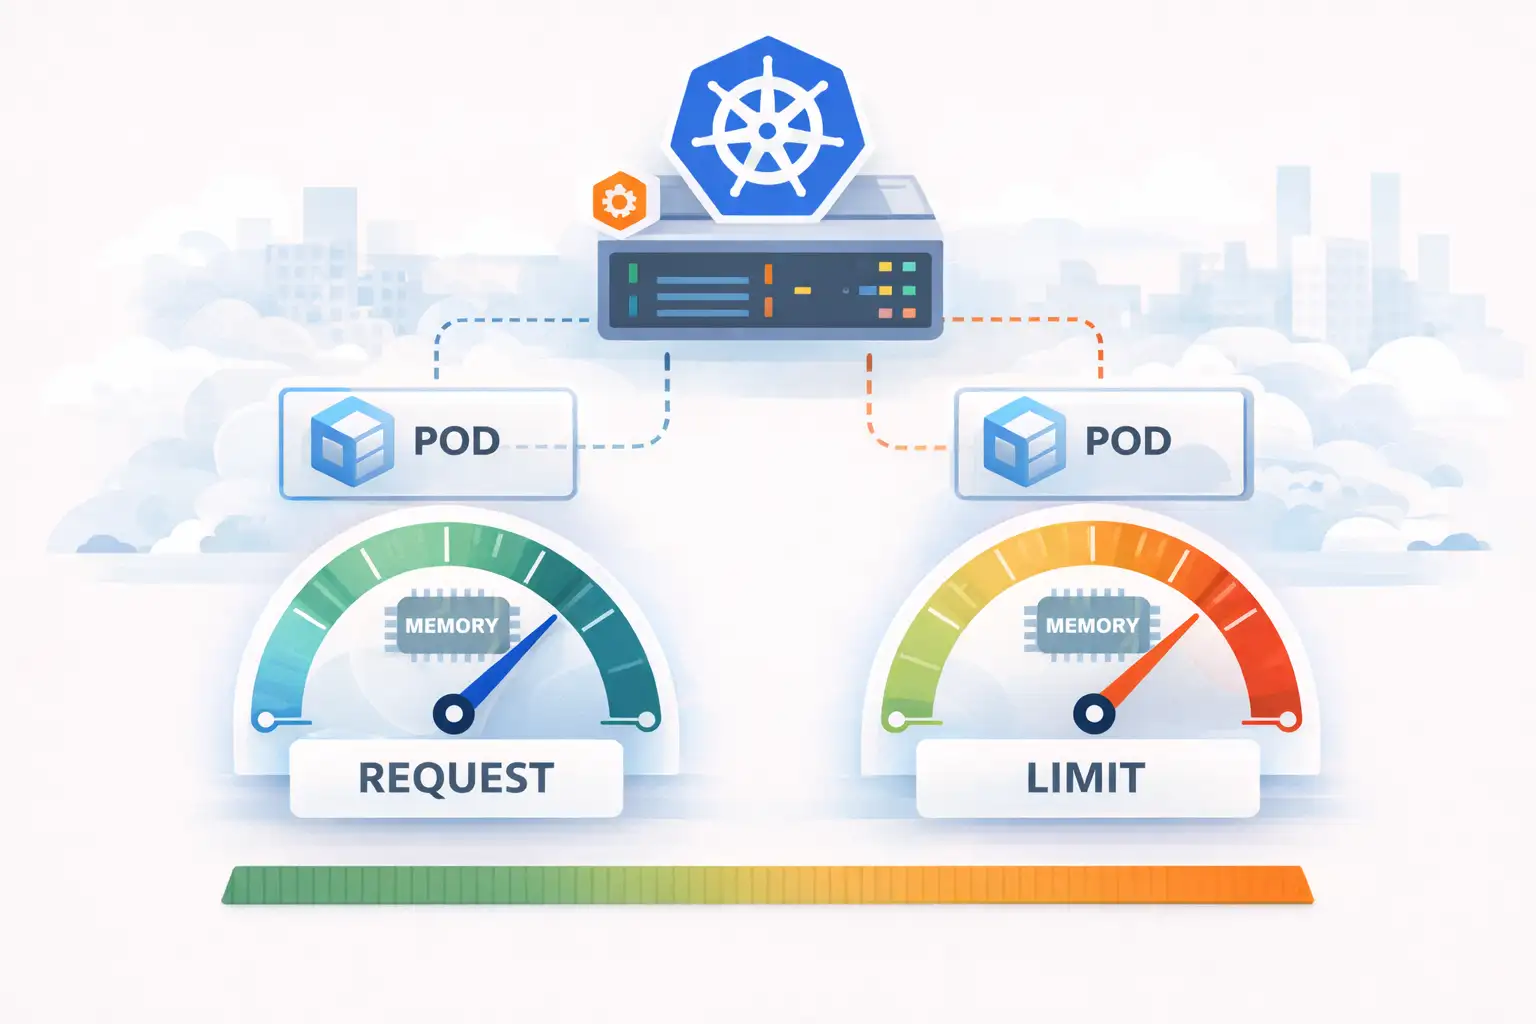
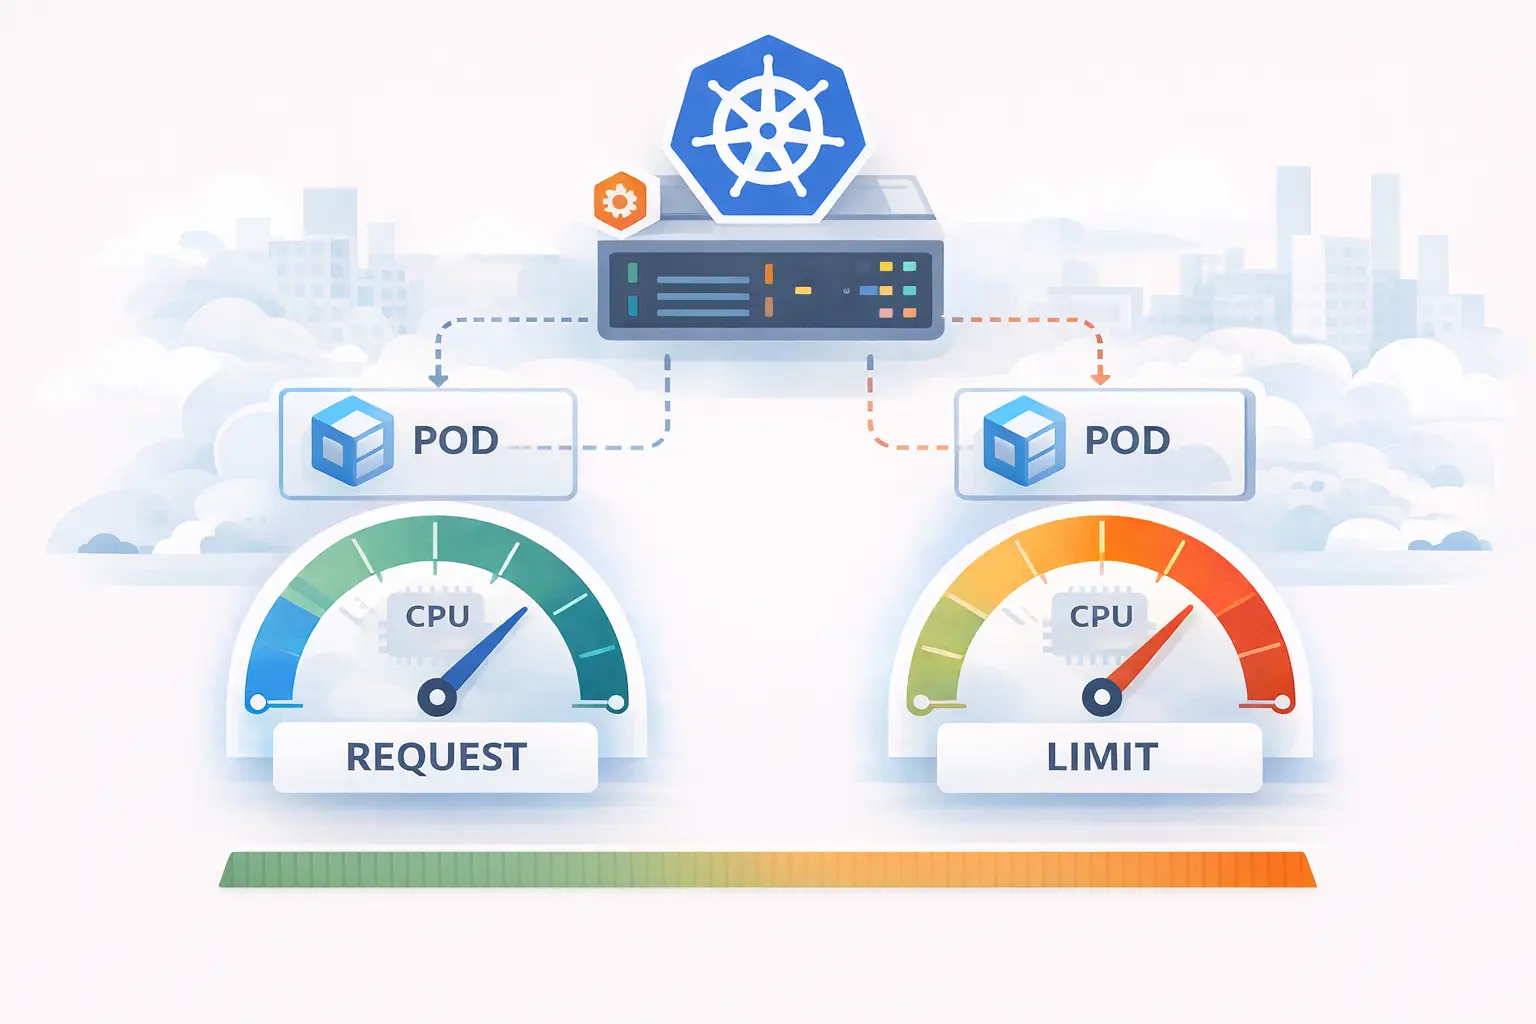
In this article I’d like to explain how the Kubernetes Horizontal Pod Autoscaler works and show working examples of scaling on CPU, on memory, and on both metrics at once. HPA works directly on resource requests, so if you don’t know how request works in Kubernetes, then I suggest that you read the previous parts on CPU request and limit and memory request and limit.
What Is HPA in Kubernetes?
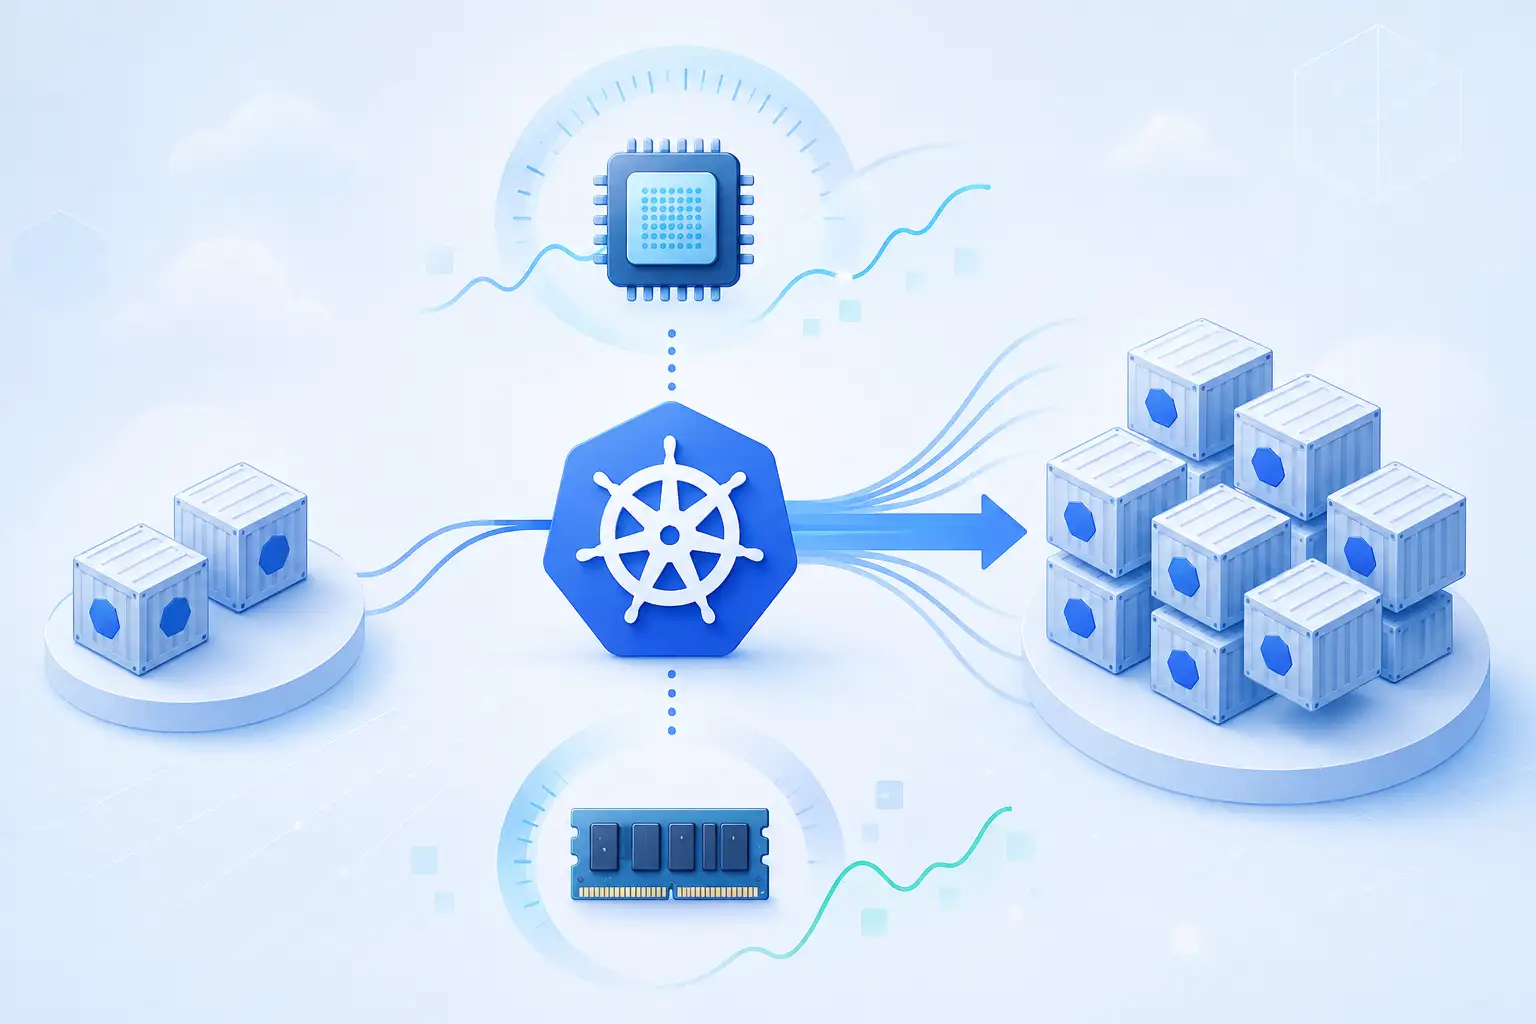
HPA (Horizontal Pod Autoscaler) is a built-in Kubernetes controller that adjusts the number of Pod replicas to match the observed CPU or memory load.
- Horizontal means more or fewer Pods with this same amount of resources. HPA never changes the CPU or memory assigned to a single Pod – that is vertical scaling, handled by the Vertical Pod Autoscaler (VPA).
- HPA is an API object (
autoscaling/v2) plus a control loop running inside kube-controller-manager that tracks this object. You declare the target state, the controller regulates the state of a system.
How the Horizontal Pod Autoscaler Works
The controller checks every 15 seconds by default, --horizontal-pod-autoscaler-sync-period for each HPA object:
- fetches the current value of each configured metric,
- calculates the desired number of replicas,
- updates the
replicasfield of the target resource if needed.
The core of the mechanism is one formula:
desiredReplicas = ceil( currentReplicas × currentMetricValue / desiredMetricValue )
This asks: if we linearly scale replicas to bring average utilization down to the target, how many pods do we need? ceil rounds up since replicas can’t be fractional.
Before acting on the formula, HPA checks the ratio currentUtilization / targetUtilization. If that ratio is between 0.9 and 1.1 (within 10% of target), HPA does nothing at all — regardless of what the formula would suggest. This exists to prevent constant, twitchy rescaling when utilization is already close to target.
Assume 3 replicas, target CPU utilization 70%, current average utilization 90%:
desiredReplicas = ceil(3 × 90% / 70%) = ceil(3.86) = 4
| currentReplicas | current utilization | target | ratio | ceil | desiredReplicas |
|---|---|---|---|---|---|
| 3 | 90% | 70% | 1.28 | 3.86 | 4 (scale up) |
| 4 | 35% | 70% | 0.5 | 2.00 | 2 (scale down) |
| 2 | 53% | 70% | 0.75 | 1.51 | 2 (no change) |
| 2 | 73% | 70% | 1.04 | 2.08 | 2 (no change) |
The last row shows an important detail: the controller has a tolerance of 0.1 (10%) by default. If the ratio of current to desired value is within 0.9–1.1, nothing happens. This prevents constant scaling on small fluctuations. So we don’t have this application scaled to 3 pods even if ceil is little above 2.
Even when desiredReplicas differs from current, a scale-down won’t fire immediately: the stabilization window (300s by default) makes the controller pick the highest recommendation from the trailing window. scale-up has a stabilization window of 0 by default, so it fires as soon as the metric crosses the threshold (on the next sync, ~15s).
Utilization is always calculated against the container’s request, not the limit. A target of averageUtilization: 70 on CPU means 70% of the CPU request. This is why HPA on resource metrics simply does not work without requests - the controller reports <unknown> and a FailedGetResourceMetric event.
Kubernetes HPA Metrics: Resource, Pods, Object, External
HPA can consume four types of metrics:
- Resource - CPU and memory of containers, served by metrics-server through the
metrics.k8s.ioAPI.
Custom metrics using custom.metrics.k8s.io API for example with Prometheus adapter:
- Pods - custom per-Pod metrics (for example requests per second), averaged across Pods.
- Object - a metric describing another Kubernetes object, for example requests per second on an Ingress.
Metrics from outside the cluster with external.metrics.k8s.io:
- External - metrics from outside the cluster, for example the length of an SQS queue.
Kubernetes HPA Custom Metrics
CPU is a proxy for load, not load itself. For many systems the honest scaling signal is requests per second, queue length, or consumer lag. HPA supports this through the custom.metrics.k8s.io and external.metrics.k8s.io APIs, typically served by one of:
- Prometheus Adapter - exposes any Prometheus query as an HPA metric,
- KEDA - a purpose-built autoscaling operator with ready-made scalers for Kafka, SQS, RabbitMQ, Cloud Watch, and dozens of other sources. Under the hood KEDA still creates an HPA object, so everything in this article applies.
If you find yourself tuning CPU targets to indirectly approximate “requests per Pod”, that’s the moment to switch to a custom metric.
HPA vs VPA in Kubernetes
The two autoscalers answer different questions:
| HPA | VPA | |
|---|---|---|
| what changes | number of replicas | CPU/memory requests of a Pod |
| direction | horizontal | vertical |
| good for | stateless, load-driven services | right-sizing requests, batch jobs, databases |
Do not run HPA and VPA on the same resource metric. VPA changes the requests that HPA uses as the denominator for utilization - the two controllers chase each other and the replica count becomes unpredictable. Safe patterns: VPA in updateMode: Off as a recommendation engine for setting requests by hand, or VPA managing requests while HPA scales on custom/external metrics.
Kubernetes HPA Best Practices
- Always set resource requests. Utilization targets are percentages of requests – without them the HPA is blind. How requests translate to actual CPU time is covered in CPU request and limit in practice.
- Leave headroom in the target. A CPU target of 70% means Pods regularly run above it between sync periods. If you also set CPU limits close to requests, that overshoot turns into CPU throttling exactly when you’re scaling up - latency spikes during traffic spikes.
- Set realistic minReplicas and maxReplicas.
minReplicas: 1on a production API means a single Pod that reduce cost when no one use application.maxReplicasshould fit in your cluster’s actual capacity – HPA scales Pods, not nodes; pair it with Cluster Autoscaler or Karpenter. - Remove the
replicasfield from manifests managed by HPA. In a GitOps setup this is a classic conflict: Argo CD keeps resetting replicas to the value in Git while HPA fights back. Drop the field (or configureignoreDifferencesin ArgoCD) and let the HPA own it. - Verify scaling events using:
kubectl describe hpa <name>shows the controller’s decisions and every reason it couldn’t scale.
Summary
HPA is one of those Kubernetes mechanisms that look trivial in a demo and subtle in production. The formula is one line, but whether it works for you is decided by the inputs: correct requests, a metric that actually tracks load, sane targets, and scale-down behavior tuned to your traffic pattern. CPU is the default signal for a reason, memory needs a critical look before you scale on it, and for queue-driven systems custom metrics are usually the honest answer.
If you want to verify your autoscaling setup, right-size requests and limits, or design the full path from HPA through Cluster Autoscaler to cost control, our team offers Kubernetes consulting based on data and metrics.