 Aleksander Roszig
April 27, 2026 | 9 min Read
Aleksander Roszig
April 27, 2026 | 9 min ReadReal-Time OEE – How to Build a Production Monitoring System on Grafana, TimescaleDB, and AWS
The manufacturing industry is one of the main areas of our specialization. Industrial plants today invest serious money in modern machinery, automation, and sensors, but the analysis of production data is often done manually, with significant delay and inaccuracy. OEE is an indicator that every production manager knows, but few can easily monitor. Most often, data flows in with a delay of a day or a week, in Excel spreadsheets manually filled out by foremen. Meanwhile, OEE calculated live from sensors and PLCs allows you to react to performance drops within minutes, as well as make better investment decisions.
What is OEE and why is it worth automating?
OEE (Overall Equipment Effectiveness) is a composite indicator that combines three parameters: machine availability, performance, and production quality. OEE = (availability) x (performance) x (quality). Availability is the percentage of time the machine is ready to work, performance is the ratio of actual production to planned production, and quality is the percentage of good units produced. OEE allows you to understand how much added value each machine generates and where the biggest losses are.
Manual OEE calculation has three serious drawbacks. First, the data is incomplete – operators don’t record every micro-stop. Second, it’s delayed – decisions are made based on conditions from several dozen hours ago. Third, it’s biased – the foreman reports what they see, not what is actually happening on the line. Automation eliminates all three problems.
How to Calculate OEE – A Step-by-Step Example
The formula is easiest to understand with concrete numbers. Take a single eight-hour shift.
Inputs: shift of 8 hours = 480 minutes, planned breaks of 30 minutes (planned production time = 450 minutes), unplanned downtime of 90 minutes (run time = 360 minutes), nominal speed of 2 pieces per minute, 612 pieces produced, of which 31 are rejects (581 good pieces).
Availability = run time / planned production time = 360 / 450 = 80.0%
Performance = actual output / theoretical output. In 360 minutes at nominal speed the machine would produce 720 pieces, so 612 / 720 = 85.0%
Quality = good pieces / total pieces = 581 / 612 = 94.9%
OEE = 0.800 × 0.850 × 0.949 = 64.5%
The same machine might “score” 85% in a foreman’s manual report, because nobody logged three four-minute micro-stops or the half hour when the line ran slow. The gap between 64.5% and 85% is real money – and the reason automated OEE measurement matters so much.
What Is a Good OEE Score?
Good OEE is conventionally taken to be around 85% – corresponding roughly to 90% availability, 95% performance, and 99.9% quality. In practice, many plants run at 40–60% and often don’t realize it, because manual reports show much higher figures.
It’s worth treating the magic 85% with caution, though. It’s a reasonable benchmark for high-volume production with a stable product mix, but for a plant with frequent changeovers or short runs it will be unreachable and misleading. More important than the absolute number is the trend over time and the comparison between lines and shifts – that’s what shows you where you’re actually losing.
OEE system architecture on AWS – what does it look like from sensor to dashboard?
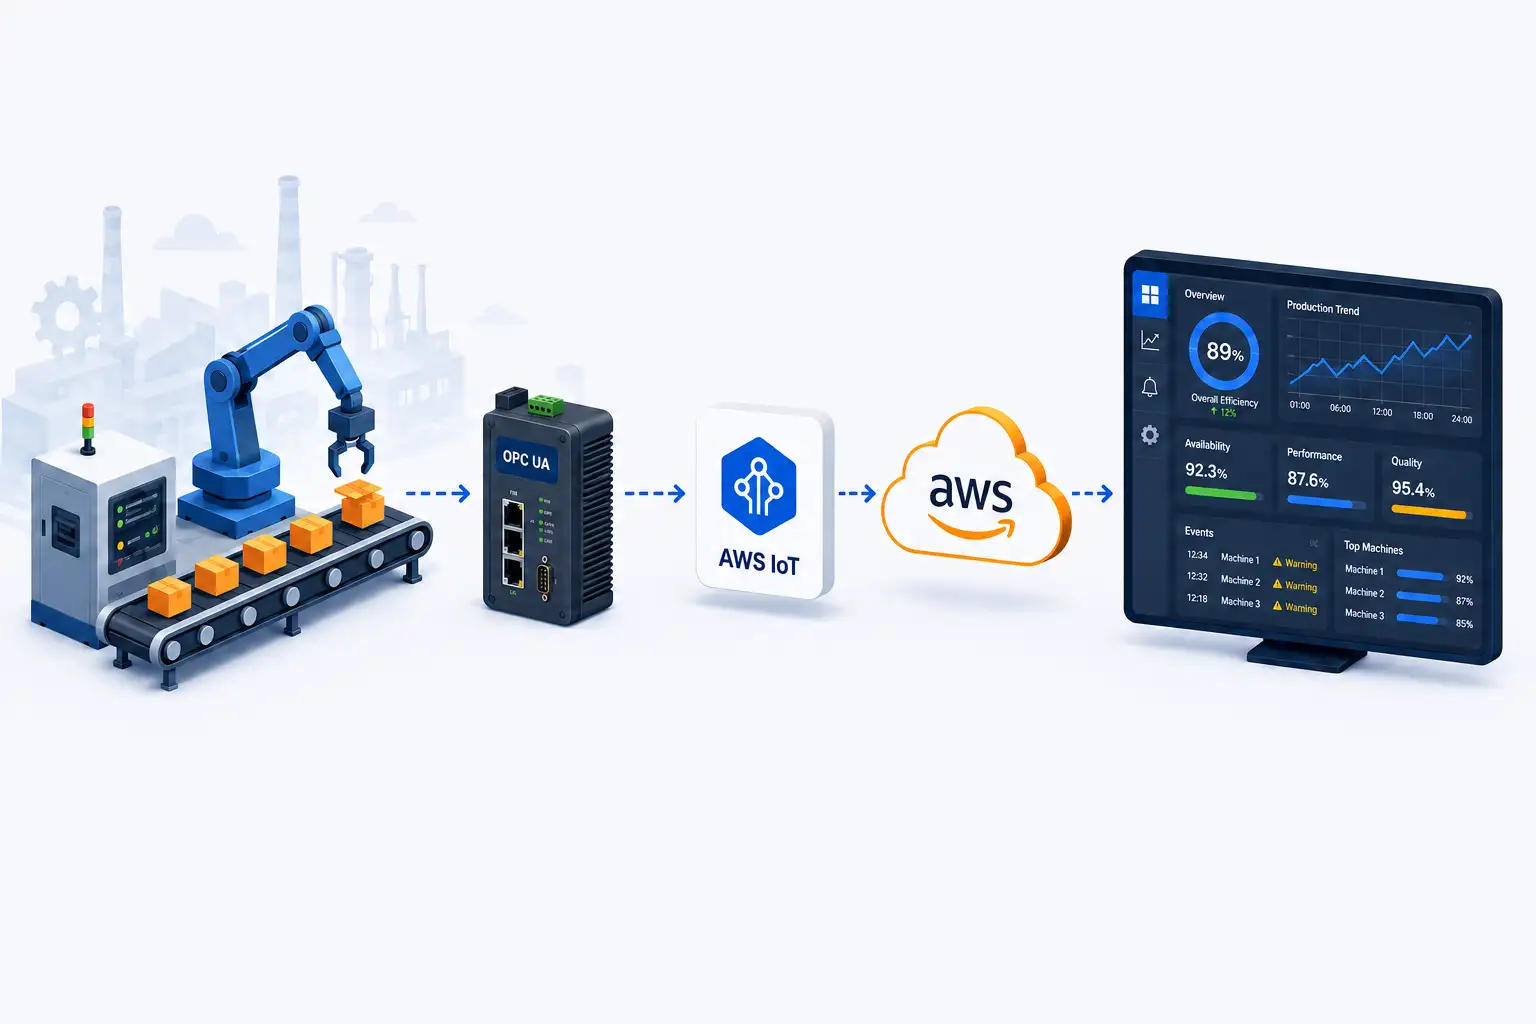
A typical system collects data from PLCs and sensors, transmits it to the cloud, stores it in a time series database, calculates indicators, and presents them on dashboards. In practice, AWS architecture most often features the following layers:
- data collection layer – PLCs, IoT sensors, HMI panels communicating via OPC UA, Modbus TCP, or MQTT protocols,
- industrial gateway – AWS IoT Greengrass or Kepware running on an industrial computer at the plant, which buffers data and forwards it even during temporary internet outages,
- transport layer – AWS IoT Core or another MQTT broker such as HiveMQ receiving data from industrial gateways,
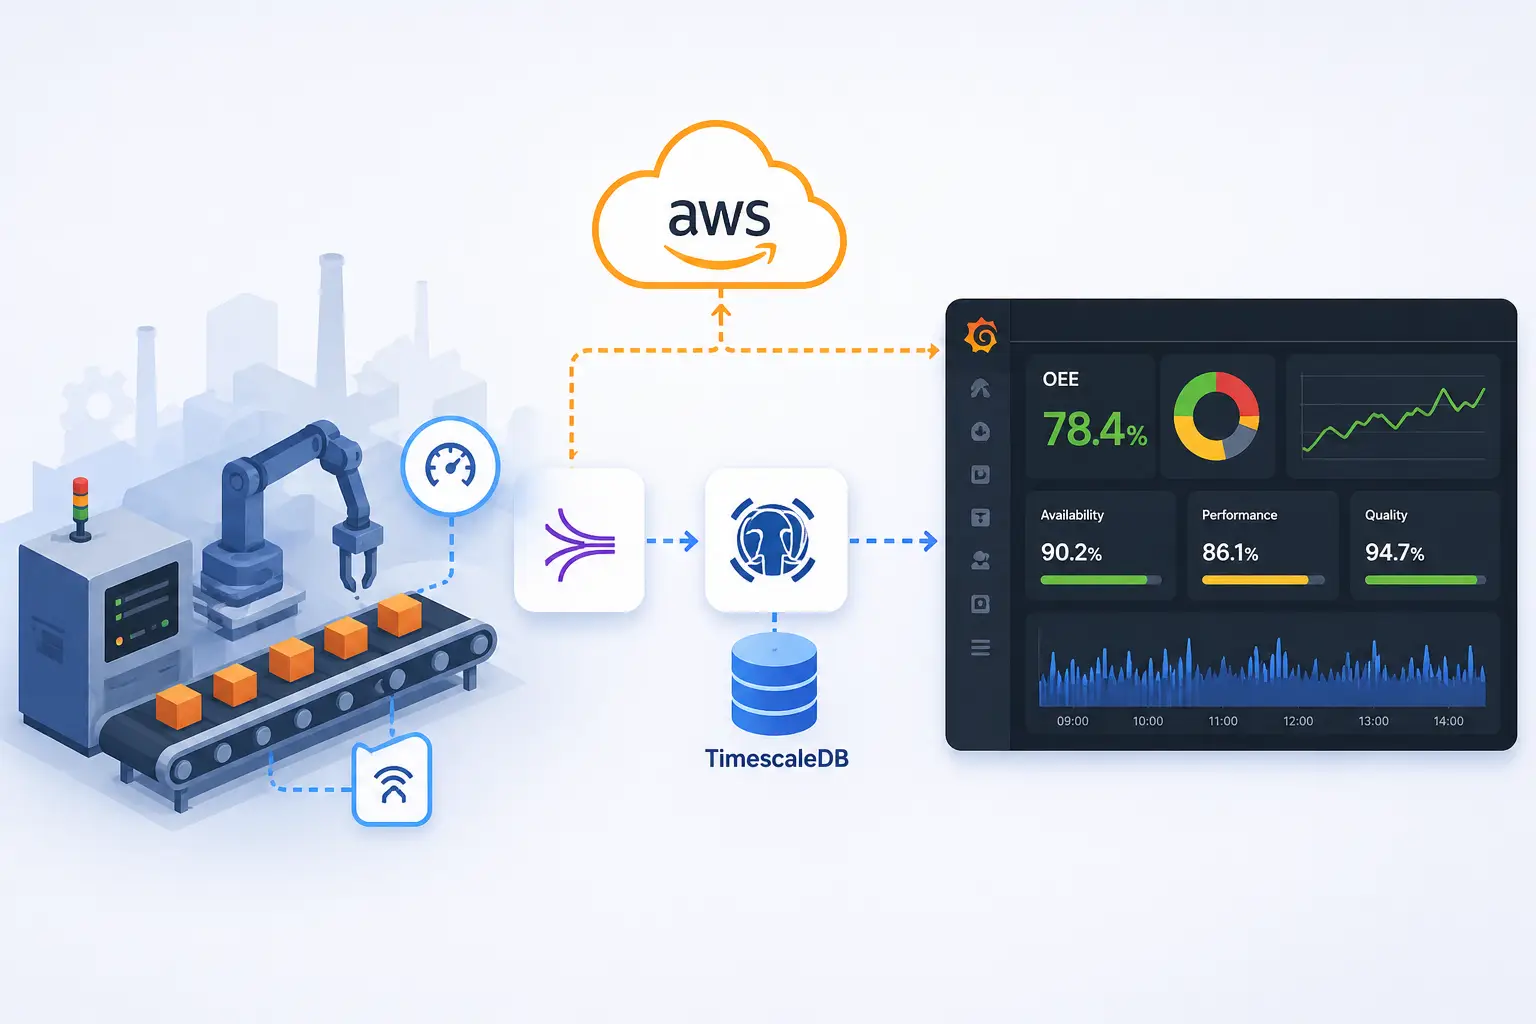
- storage layer – TimescaleDB running on Amazon RDS for PostgreSQL or on EC2 for full control,
- visualization layer – Grafana with dedicated OEE dashboards and reports, accessible to operators on the shop floor and to management.
The key is separating the OT and IT layers through an industrial gateway. Machines never connect directly to the cloud – all communication from the shop floor goes out through the gateway, which acts as a firewall between the production world and the IT world. The gateway enforces one-way traffic (from the shop floor to the cloud, never the other way around), encrypts data streams, and gives the administrator a single point to monitor and cut off the connection in case of an incident.
Why TimescaleDB and not plain PostgreSQL or Microsoft SQL Server?
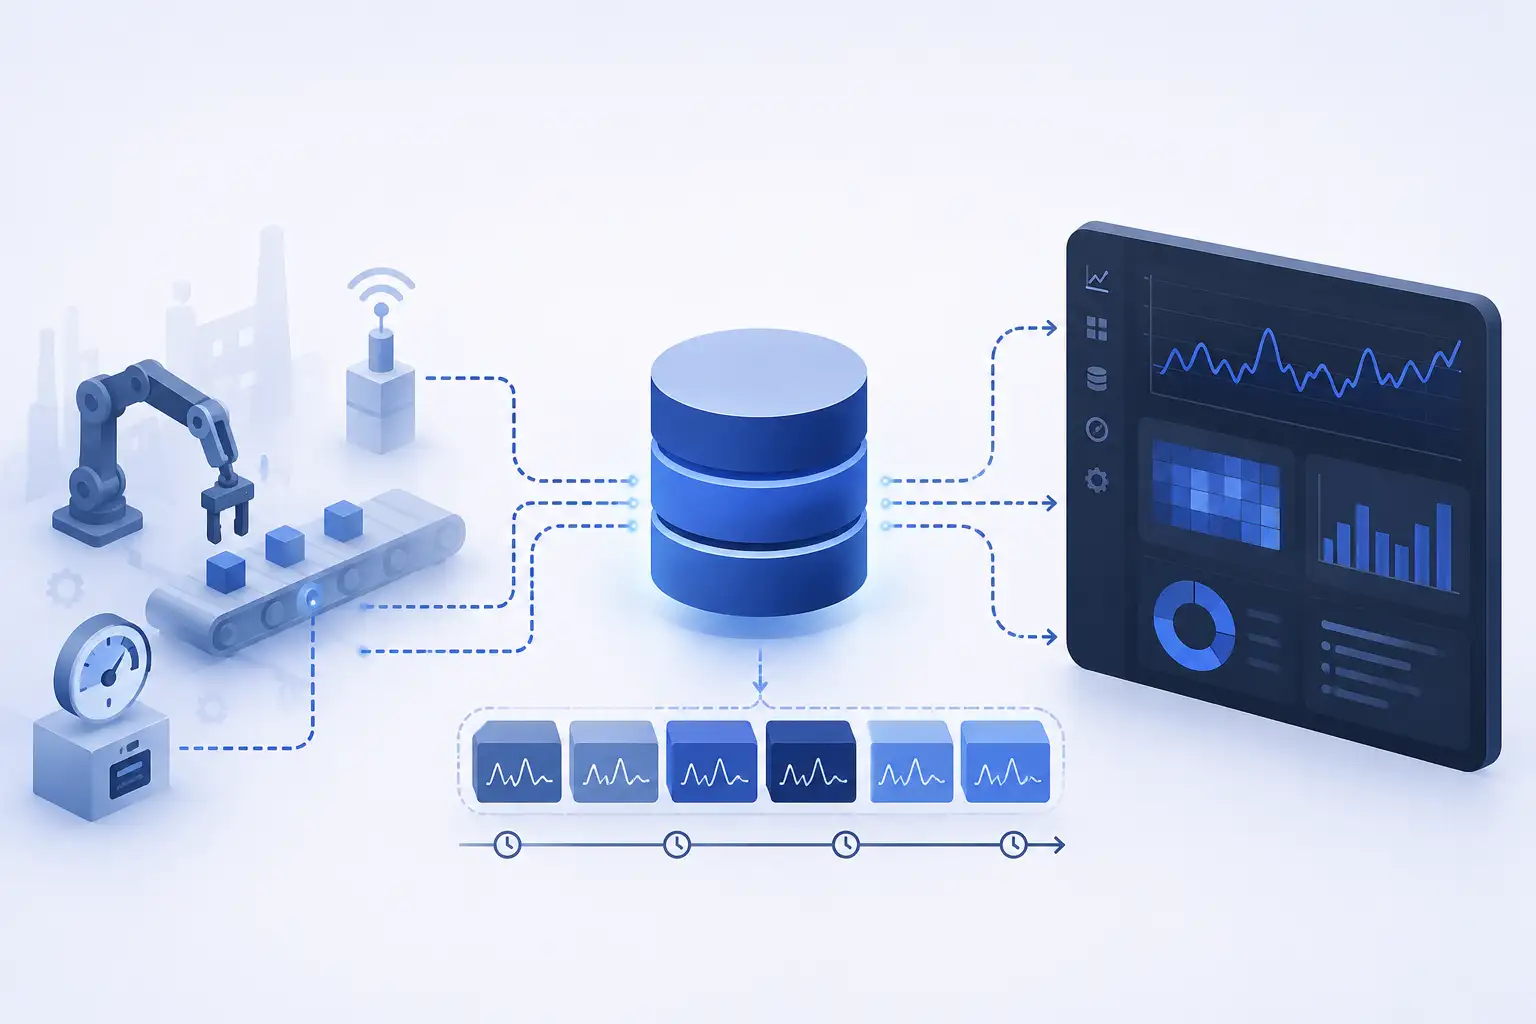
Data from the production floor is a classic case of time-series data – thousands of measurement points recorded every second. Standard PostgreSQL or Microsoft SQL Server can handle this up to a point, but with several million rows, queries start taking minutes, which makes it impossible to view dashboards in real time and to easily browse data.
TimescaleDB solves this problem through automatic time-based table partitioning (hypertables) and compression of historical data by up to 95%. It maintains full SQL syntax and all the tools of the PostgreSQL ecosystem – ORMs, BI tools, the permission system. This is a huge advantage over solutions with their own query dialect. As a result, employees don’t have to learn a new language, and existing reports and dashboards can be easily migrated to TimescaleDB without the need for rebuilding. At the same time, you can move some other workloads to PostgreSQL and eliminate costly licenses for Microsoft SQL Server or another database.
In practice, with well-configured compression, a year’s worth of data from a production line takes up around a dozen gigabytes instead of several hundred. Queries about KPIs from the last month take milliseconds rather than seconds.
OEE deployment step by step – the five stages of the project
A proven deployment methodology minimizes risk and allows you to quickly demonstrate business value.
- Machinery audit – we inventory PLCs, sensors, communication protocols, and identify gaps in the data.
- Pilot on one line – you choose the most critical or problematic line and we build the full pipeline from sensor to dashboard. The pilot typically lasts 6–10 weeks and ends with a working real-time OEE indicator.
- Data validation with operators – we compare the automatic results with manual reports from foremen. Differences are inevitable and often reveal real problems that were previously hidden in manual records.
- Scaling to additional lines – once the architecture is proven, adding more lines is mainly a matter of configuring additional machines and sending data, without building the system from scratch.
- Developing indicators and predictive maintenance – with historical data, you can add more KPIs, predictive failure models, and energy consumption analytics.
Grafana dashboards that work on the shop floor and in the boardroom
One of the most common mistakes is building a single dashboard for everyone. An operator on the line needs different information than a shift manager, and the latter, in turn, needs different information than a production director.
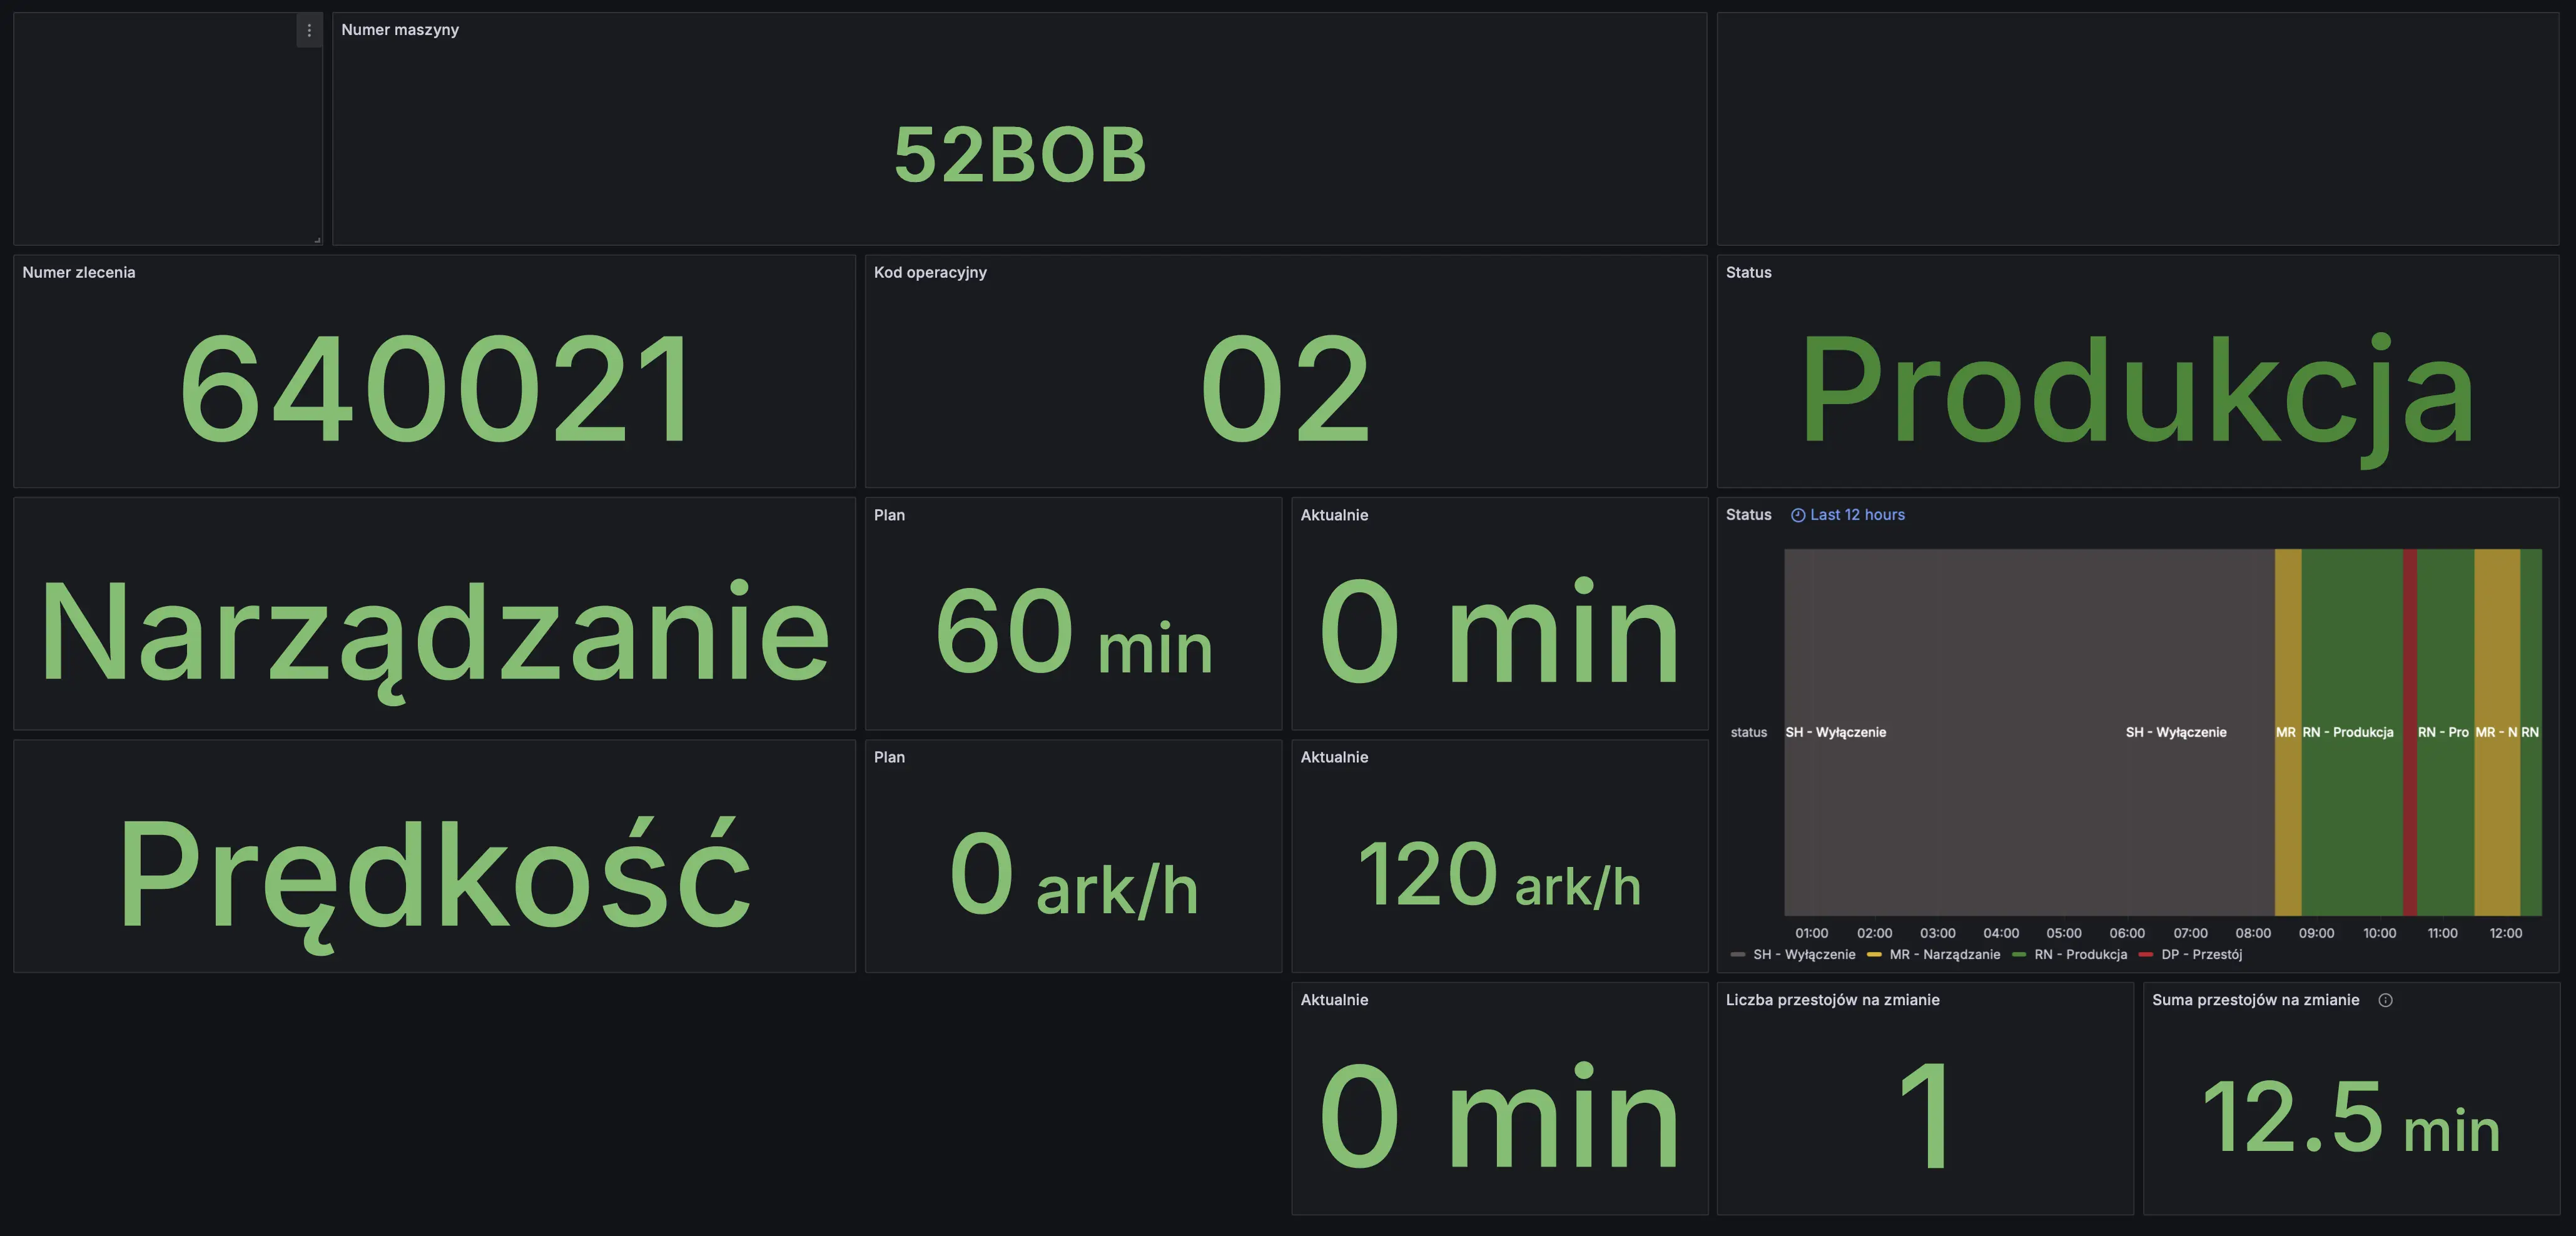
For operators, dashboards with large indicators visible from several meters away work best, showing the current OEE, the cause of the last stoppage, and production pace relative to the plan. For managers – comparisons of lines and shifts, the top 5 causes of losses, weekly trends. For the board – monthly reports, cost of losses, comparisons between plants.
Grafana handles these three levels excellently. Dashboards can be displayed on TVs on the shop floor (kiosk mode), on managers’ tablets, and on workstations in the office – with the same data source and the same backend architecture.
Where to start with real-time OEE deployment?
The best first step is to audit one production line and run a pilot. The pilot demonstrates the real value of the solution, verifies technical assumptions, and gives management concrete numbers for discussions about scaling to the rest of the plant.
If you don’t have in-house expertise combining AWS, time series databases, and machine data transmission protocols, we will guide you through the pilot, and afterwards either hand it over to your team for independent management, or take over the entire administration with our internal team. Schedule a call with our architects, and we will assess your production environment and propose a plan tailored to the specifics of your factory.
FAQ
How long does it take to deploy an OEE system on AWS?
For a single production line with several machines, the pilot typically takes 6 to 10 weeks. The requirements gathering and PLC integration phase accounts for approximately 40–50% of the project, because every plant has a different combination of controllers, protocols, and machine age. Scaling the solution to additional lines after a successful pilot takes significantly less time, since the cloud architecture and dashboards are already ready for reuse.
How do you calculate OEE and what is the formula?
OEE = Availability × Performance × Quality. Availability is run time divided by planned production time, performance is actual output divided by theoretical output at nominal speed, and quality is the share of good pieces in total output. Example: 80% × 85% × 95% ≈ 64.5%.
What is a good OEE score?
World-class OEE is conventionally taken to be around 85% (90% availability, 95% performance, 99.9% quality). In practice many plants run at 40–60%. The right target depends on the industry, so the trend and comparison between lines matter more than the absolute number.
How much does monthly maintenance of such a system cost?
For a small production line with around a dozen machines and a thirty-second sampling rate, the monthly cost of AWS infrastructure typically falls in the range of three hundred to several thousand euros. The main factors influencing the price are the number of measurement points, the sampling frequency, and the data retention period. Most of the cost is generated by data storage, which is why a well-designed retention and compression strategy can reduce bills by up to half.
Do I need to replace my PLCs to collect data in AWS?
Most often, no. The majority of PLCs from the last 15 years support OPC UA, Modbus TCP, or Siemens S7 protocols, which AWS IoT Greengrass or Kepware can handle without interfering with the controller. Replacing a PLC is only necessary in extreme cases when a machine doesn’t expose any communication interface.
How does PostgreSQL TimescaleDB differ from other SQL databases?
TimescaleDB is a PostgreSQL extension that retains full SQL compatibility and the Postgres ecosystem. It differs from other SQL databases in that it is optimized for time series data, which is the predominant data type in IoT.
Is cloud-based OEE secure for production data?
Yes, provided the architecture is designed with OT and IT network segmentation in mind. Data from the production floor should flow through the industrial gateway in one direction – from the plant to the cloud – without the possibility of remote machine control. The connection to AWS is established via VPN, and the data itself is encrypted both in transit and at rest.