Grafana Monitoring & Observability Services
Turn Metrics Into Actionable Insights With Grafana
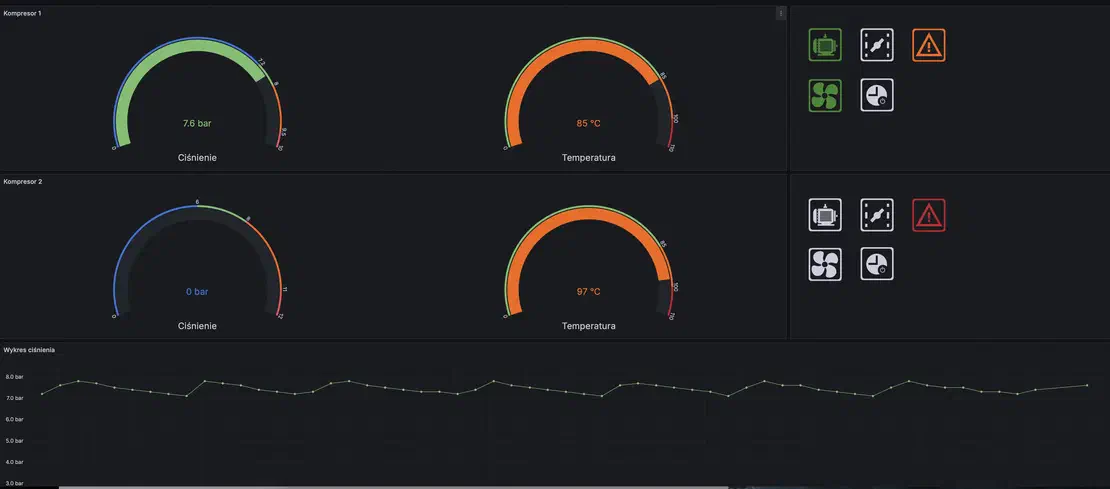
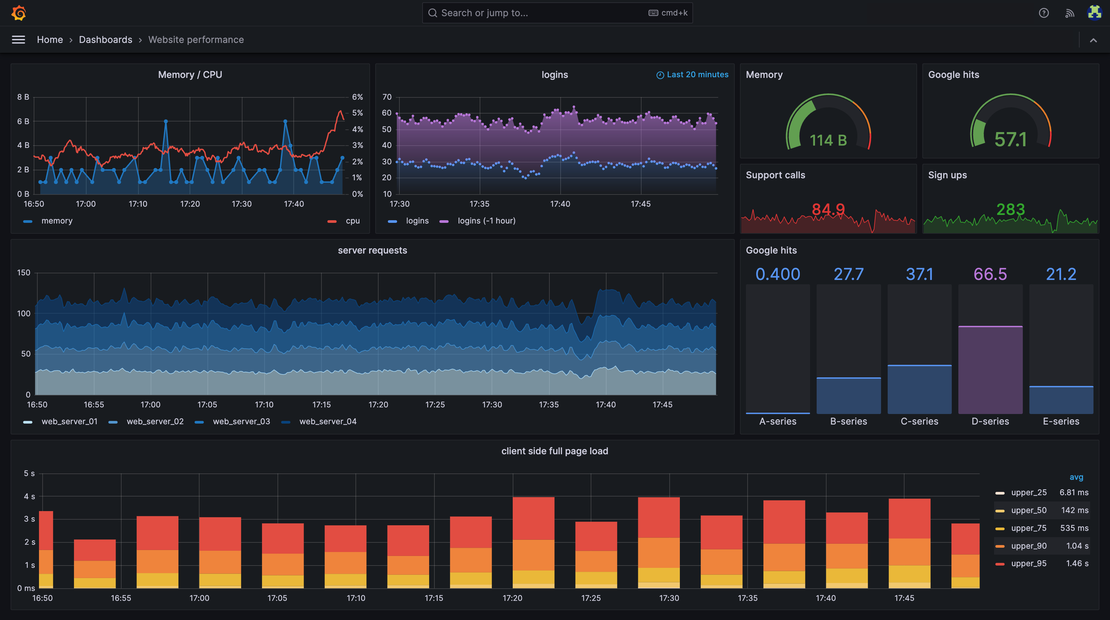
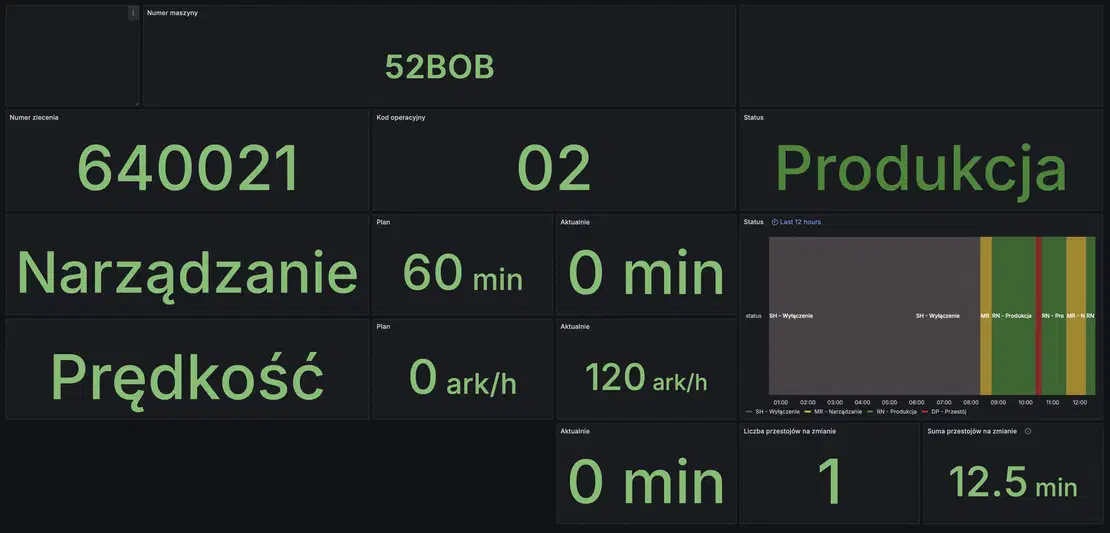
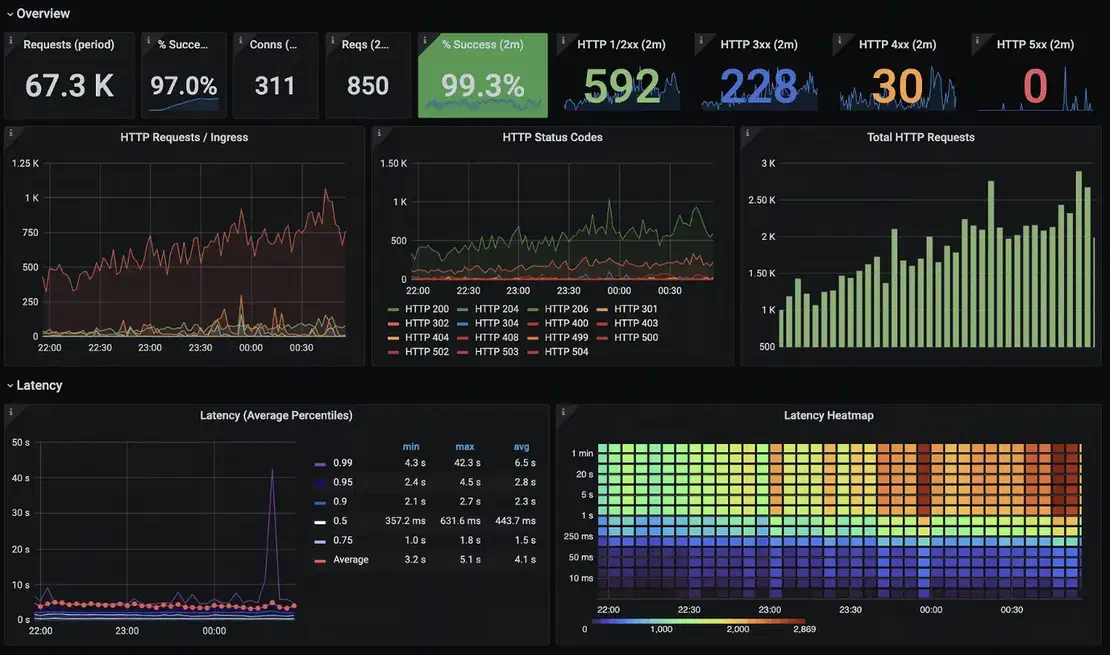
Custom Grafana Dashboards
Dashboards designed for clarity and fast decision-making We design Grafana dashboards tailored to your workloads and teams.
- Application, infrastructure, and business KPIs
- Real-time and historical performance views
- Role-based dashboards for engineers, managers, and executives
- Alerting rules and notifications to catch issues before they impact users
Full-Stack Observability
Monitor metrics, logs, and traces in one place We integrate Grafana with your existing observability stack:
- Prometheus, Loki, Tempo, OpenTelemetry
- AWS CloudWatch, Databases, ERP, and third-party data sources
- MQTT, IoT, production lines in manufacturing
- Kubernetes, Docker, and microservices environments
Why Choose Our Grafana Services?
We go beyond basic dashboards. Our Grafana implementations are built around operational excellence, helping teams reduce MTTR, improve reliability, and scale observability as systems grow.
Our Grafana Implementation Approach
Our proven process ensures long-term value:
- Requirements gathering & observability strategy
- Data source integration & metric design
- Dashboards and alerts creation
- Knowledge transfer and documentation
You receive production-ready dashboards, alerting rules, and best-practice guidance.
Security, Access & Performance Best Practices
We implement Grafana securely and at scale. This includes role-based access control (RBAC), authentication integration, optimized queries, and high-availability setups aligned with enterprise and cloud-native best practices.