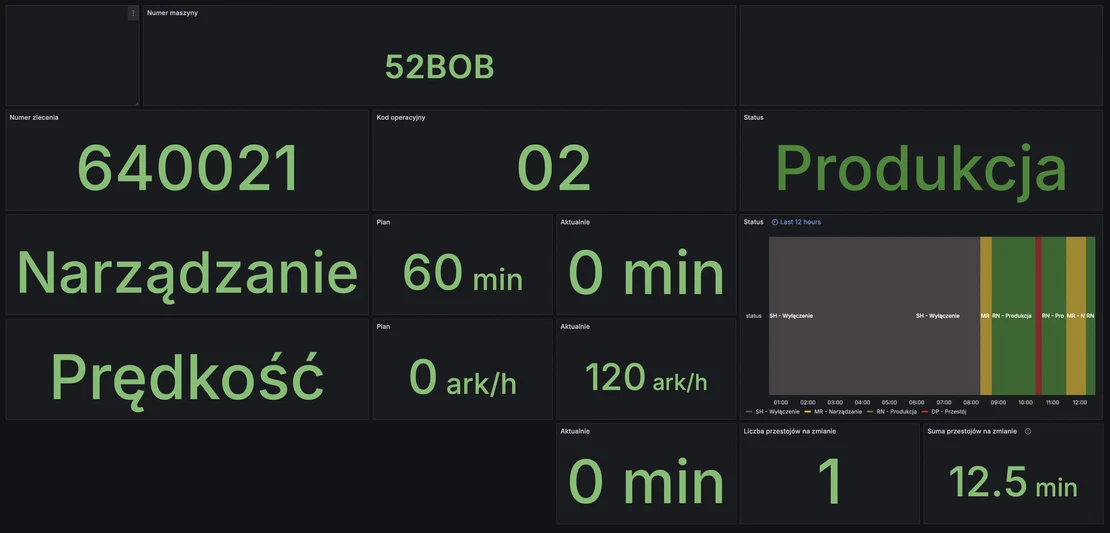
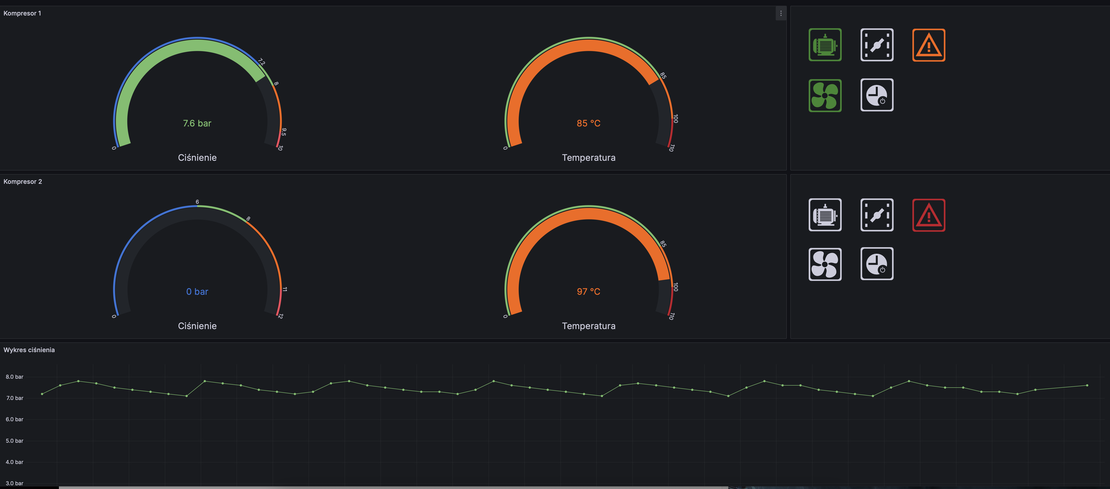
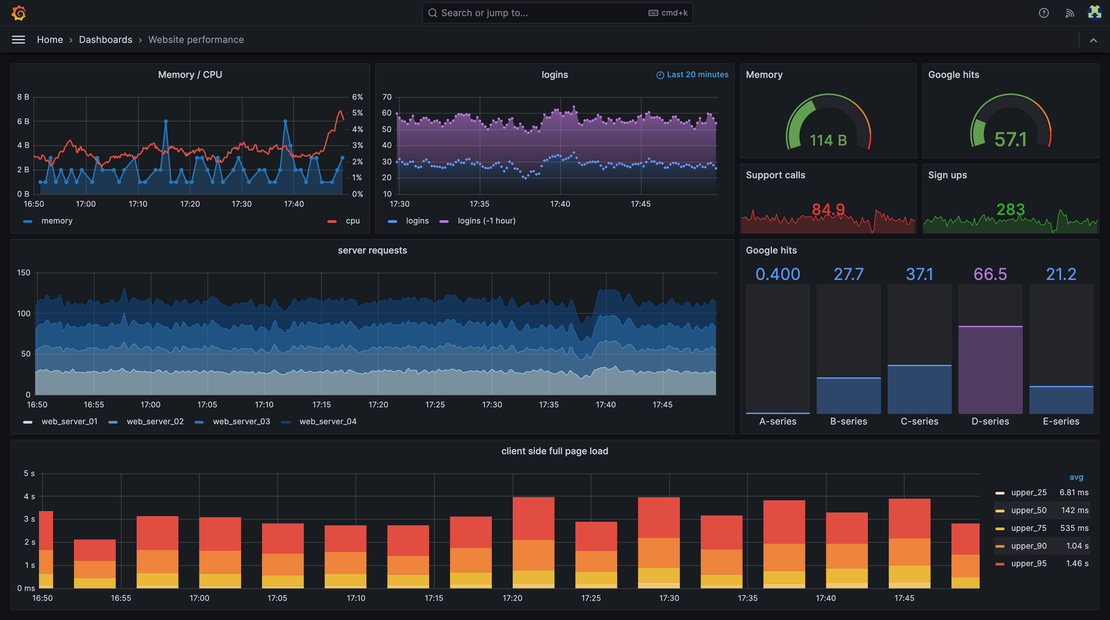
Grafana Monitoring & Observability Services

Get complete visibility into your systems with Grafana. We design, deploy, and optimize Grafana dashboards to help teams monitor performance, detect issues faster, and make data-driven decisions.

Request Grafana Setup

Turn Metrics Into Actionable Insights With Grafana

Our Grafana services help organizations build a unified observability platform for metrics, logs, and traces. We create clear, reliable dashboards that give engineering, DevOps, and business teams real-time visibility into system health and performance.

Custom Grafana Dashboards

Dashboards designed for clarity and fast decision-making We design Grafana dashboards tailored to your workloads and teams.

  • Application, infrastructure, and business KPIs * Real-time and historical performance views * Role-based dashboards for engineers, SREs, and leadership

Full-Stack Observability

Monitor metrics, logs, and traces in one place We integrate Grafana with your existing observability stack:

  • Prometheus, Loki, Tempo, OpenTelemetry * AWS CloudWatch, Azure Monitor, GCP * Kubernetes, Docker, and microservices environments

Production-Ready Grafana in Days — Not Weeks

We deliver scalable, secure Grafana setups quickly—whether self-hosted or Grafana Cloud. Our experts follow best practices for performance, security, and maintainability.

For DevOps & SRE Teams

Improve reliability with proactive alerting, faster incident response, and clear system visibility.

Why Choose Our Grafana Services?

We go beyond basic dashboards. Our Grafana implementations are built around operational excellence, helping teams reduce MTTR, improve reliability, and scale observability as systems grow.

Our Grafana Implementation Approach

Our proven process ensures long-term value: 1) Requirements gathering & observability strategy 2) Data source integration & metric design 3) Dashboard and alert creation 4) Knowledge transfer and documentation You receive production-ready dashboards, alerting rules, and best-practice guidance.

Security, Access & Performance Best Practices

We implement Grafana securely and at scale. This includes role-based access control (RBAC), authentication integration, optimized queries, and high-availability setups aligned with enterprise and cloud-native best practices.

Get Clear Visibility Into Your Systems With Grafana

Schedule a no-obligation call with an observability expert. Learn how Grafana can help your teams monitor smarter, respond faster, and operate with confidence.
Talk to a Grafana Expert